Skip to content
Consensus Weather

Seven forecasts.
One honest number.

Most weather apps show you one forecast and sound very sure about it. This one asks seven weather models, averages them, and tells you how much they disagreed. So you know when to trust it, and when to take an umbrella anyway.

Open the app

Free · No ads · No account · Any phone browser

  • ECMWF
  • GFS
  • ICON
  • GEM
  • UK Met Office
  • MET Norway
  • DWD
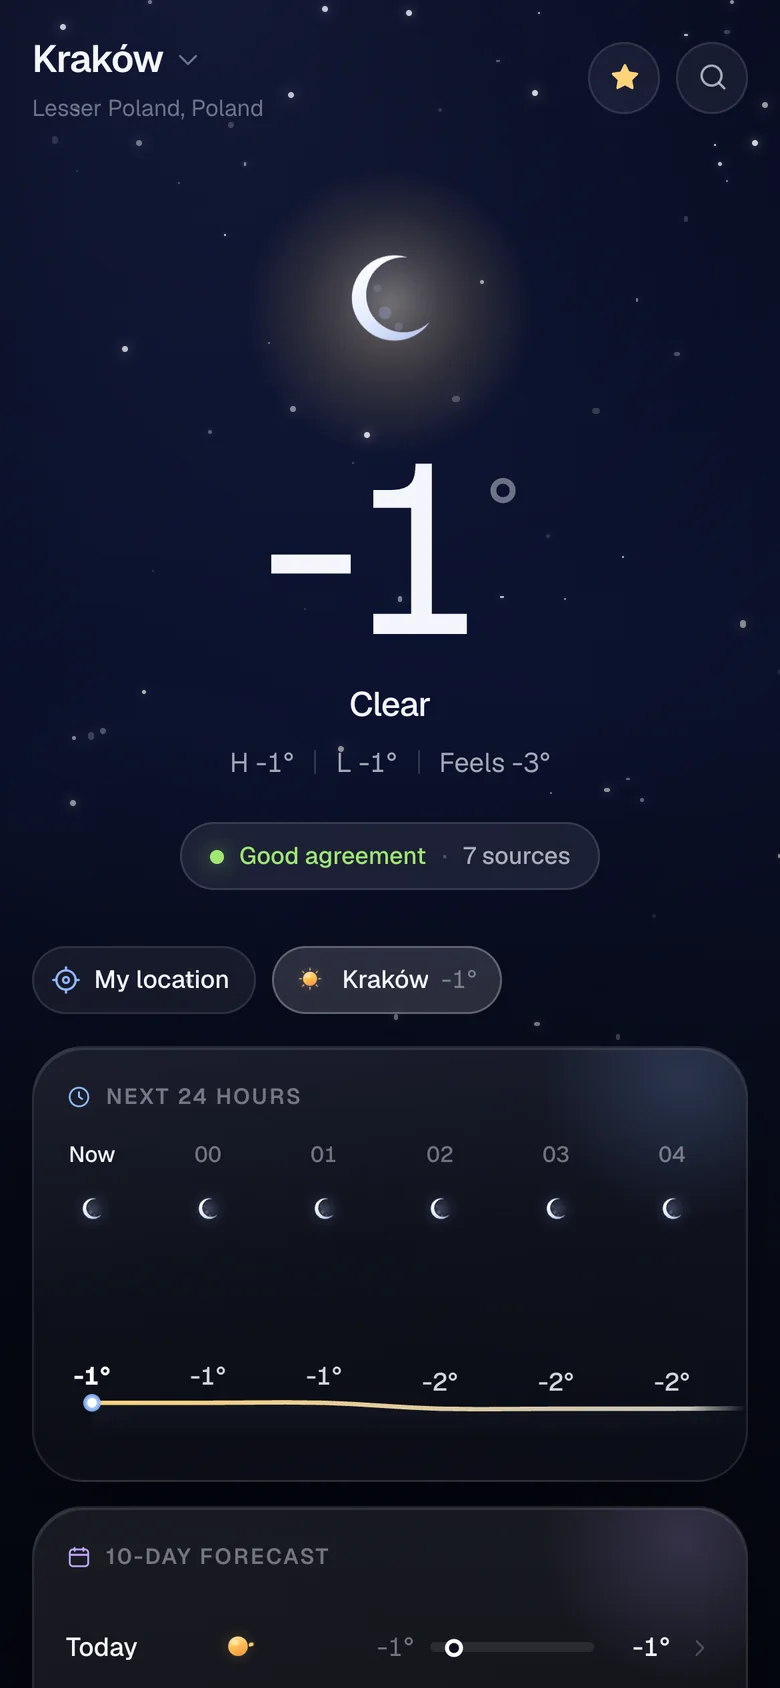
Home screen for Kraków: minus 1 degree, clear night, with a Good agreement chip and 7 sources.

How it works

How one number gets made

  1. 01

    Ask seven models

    ECMWF, GFS, ICON, GEM, UK Met Office, MET Norway and DWD. Seven independent models, not seven apps reselling the same one.

  2. 02

    Average the numbers, vote on the sky

    Temperature, wind, rain and the rest get averaged. The sky goes to a majority vote, and a tie goes to the worse weather. A storm never loses to a sunny guess.

  3. 03

    Show the spread

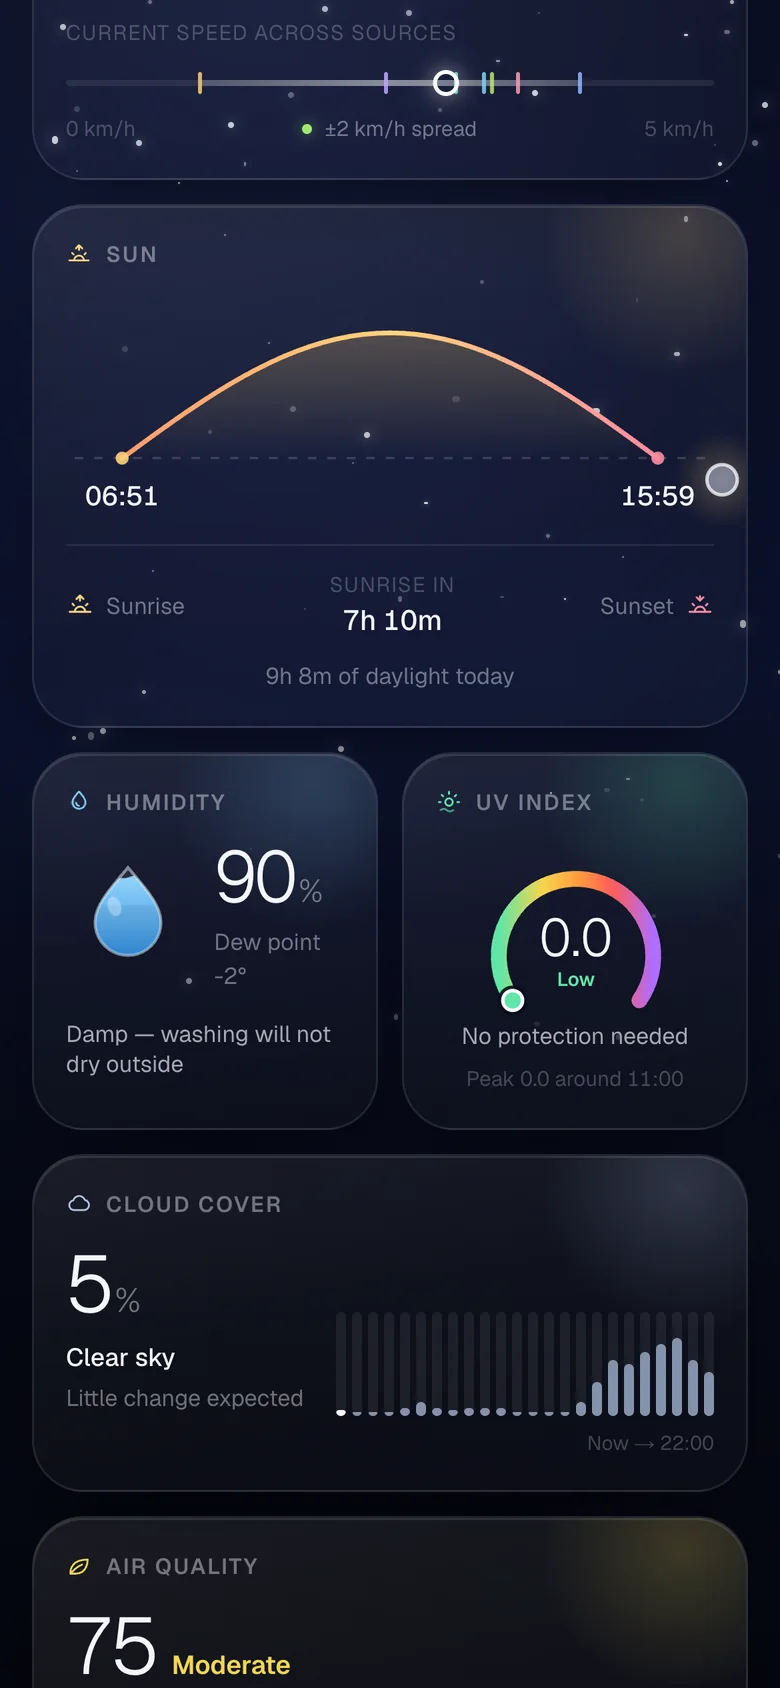
    Most cards get a small strip: a dot for the average, a tick per model, a band for the range. Wide band? Take the big number with a pinch of salt.

Temperature · Kraków

Sources disagree

−1°

average of 7
8° between highest and lowest

Agreement
0%
−10°−5°0°+5°
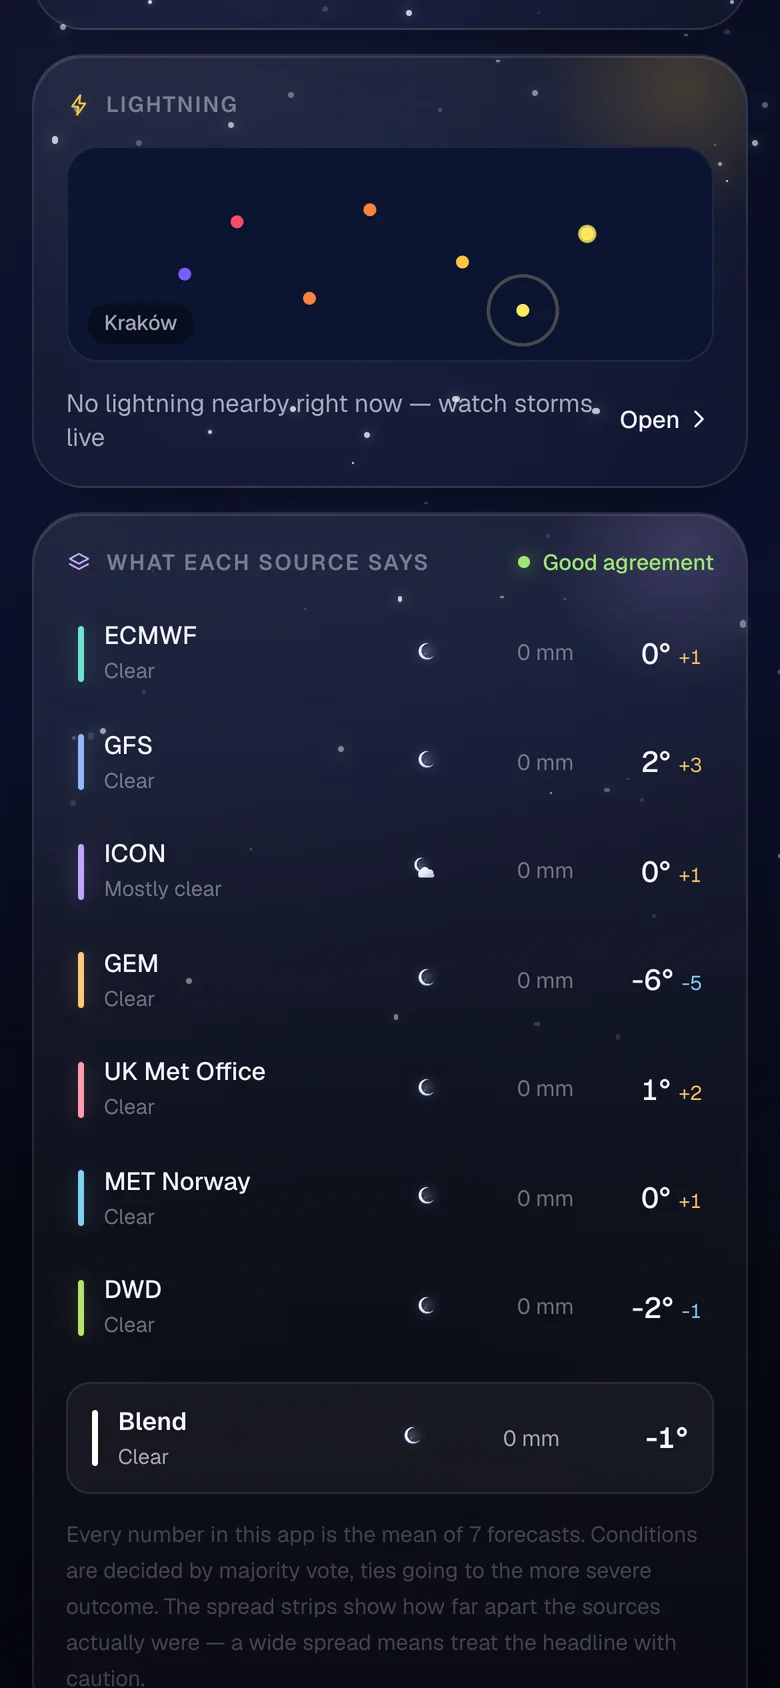
  • ECMWF0°
  • GFS2°
  • ICON0°
  • GEM−6°
  • UK Met Office1°
  • MET Norway0°
  • DWD−2°

Drag a model, or focus it and use the arrow keys.

Real readings from a cold November night in Kraków. GEM thinks it’s much colder than everyone else. Drag it back in line, then pull the others closer, and watch the agreement climb.

One forecast is a guess. Seven that agree is a plan. Seven that don’t? Bring a coat.

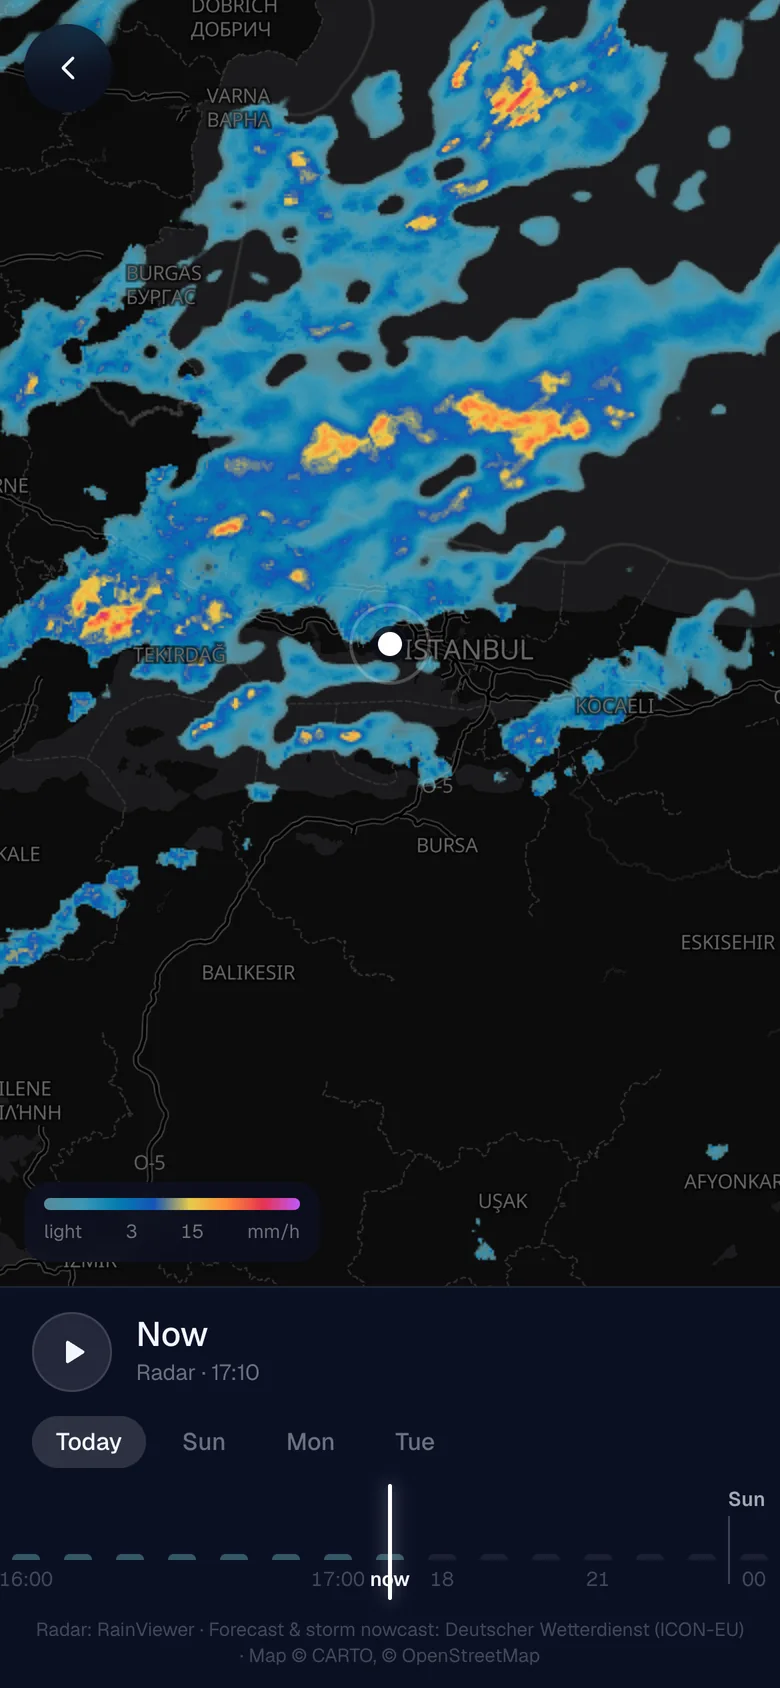
Rain map over Istanbul. Radar shows heavy rain to the north west, with an hour slider at the bottom.

Rain map with a real time slider

Scroll through the last two hours of radar and the next four days of forecast rain on one map. Hit play and watch the rain move in. Storm warnings sit on top.

Behind the scenes

  • The past is real radar from RainViewer.
  • The future is the German weather service’s ICON model. The app pulls raw rain amounts, hour by hour, and paints them in your browser.
  • One colour scale. Radar tiles get repainted too, so when the slider crosses from radar to forecast, nothing jumps.
  • Honest limits. Forecast rain covers Europe only. Elsewhere you get radar.
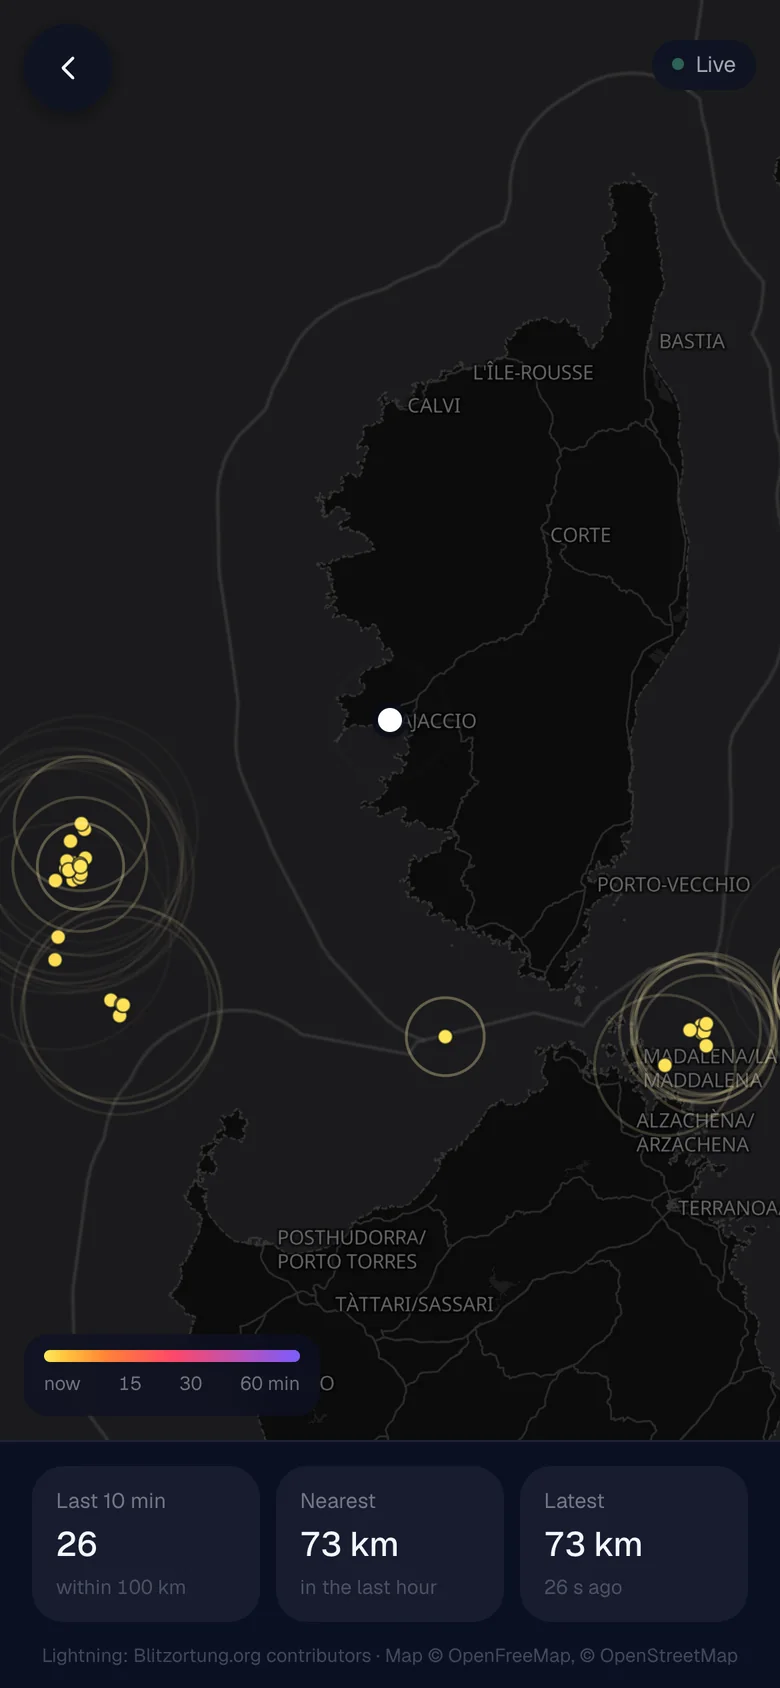
Live lightning map around Corsica: yellow strike dots off the coast, each with a ring spreading out, and 26 strikes counted in the last 10 minutes.

Live lightning, with a thunder countdown

Strikes from the last hour, coloured by age. When one lands close, the app tells you when you’ll hear it.

Behind the scenes

  • Straight from the source. Your phone listens to Blitzortung, a volunteer network of lightning receivers, over a live connection. No server in between.
  • It remembers. The feed has no history, so the app starts listening the moment it opens and keeps the last hour.
  • Physics, basically. Every strike sends out a ring that grows at 343 m/s, the speed of sound. When the ring reaches your pin, that’s the thunder.

And everything else you’d expect

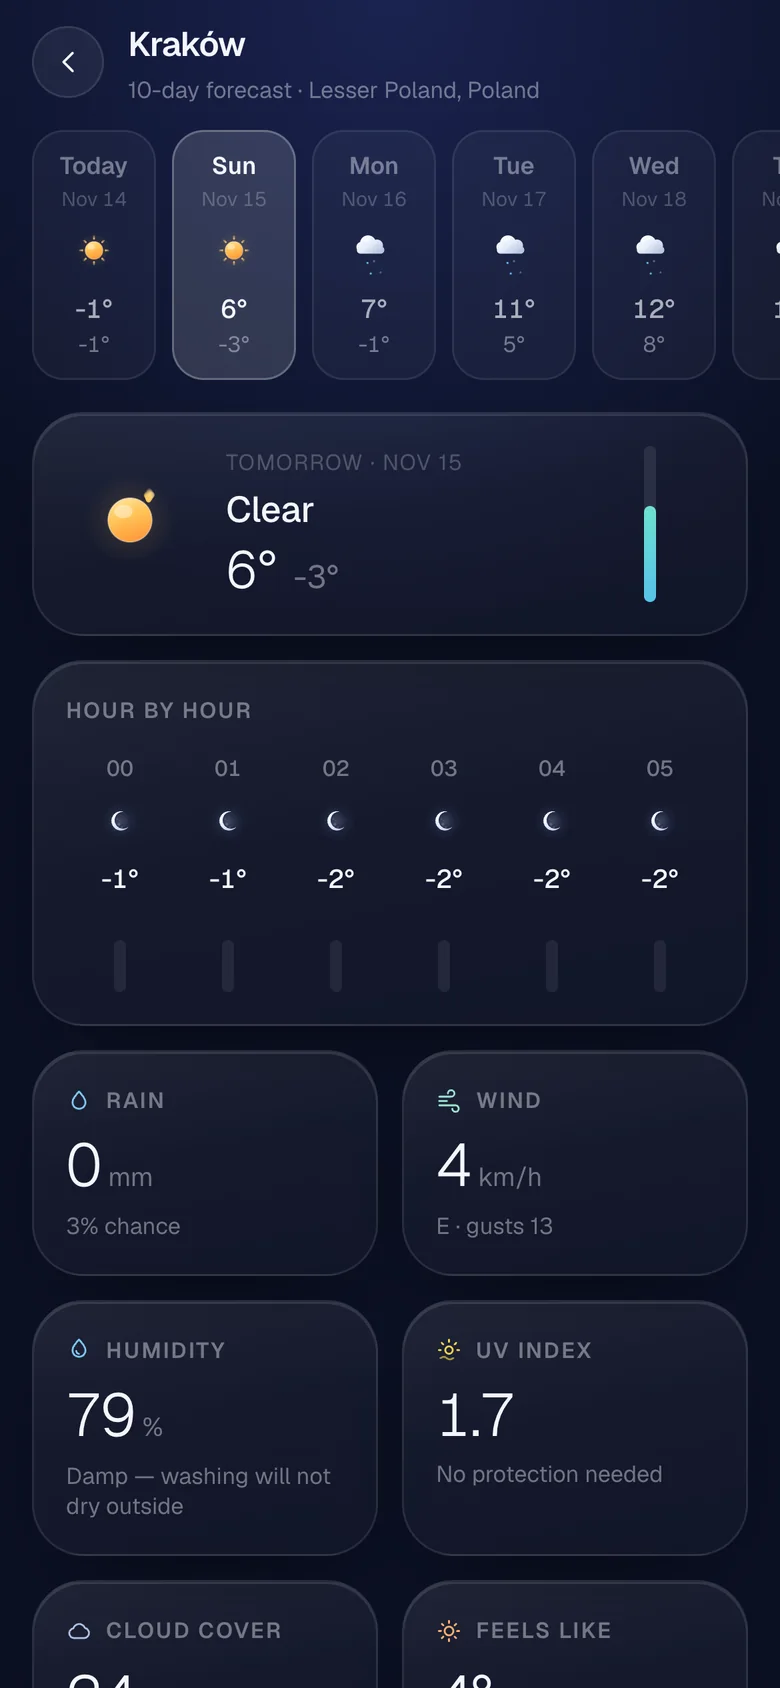
24 hours, 10 days, and a card for every number worth checking. Each one shows the spread too.

Under the hood

Free data, no accounts, no tracking

  • No keys, no accounts

    Every source is free and public. Your places and settings stay on your phone.

  • Fetched once an hour

    The server asks every source at once and caches the answers. If one is down, the blend gets narrower instead of breaking.

  • Blended on your phone

    The averaging, the voting and the agreement score all run in your browser.

  • Built with

    Next.js, MapLibre and OpenFreeMap. Data from Open‑Meteo, MET Norway, DWD via Bright Sky and Copernicus.

Check the weather.
All seven of them.

It works best on a phone. Add it to your home screen and it opens like any other app.

Open the app